I added your suggestions to my to do List for this project - that has grown way beyond anything I would have imagined in the beginning.
So far I think I have completed most basic functionality. In this update I'm going to introduce grids.
Currently Grids are visible by default - they scale automatically however I don't like how I it currently - I might change how it is done in the future.
The Grid is on the field not attached to the window and I don't plan to add a feature for that.
Here are the new functions:
Access Grid functionality:
Set the grids color:
Default is 0x7E7E7E
Set the grids visibility:
Default is 1
Set the grids origin:
Point is an array like [ x, y ]. Default is [ 0, 0 ]
Set the grids size:
Size is an array like [ x, y ]. Default is [ 1, 1 ]
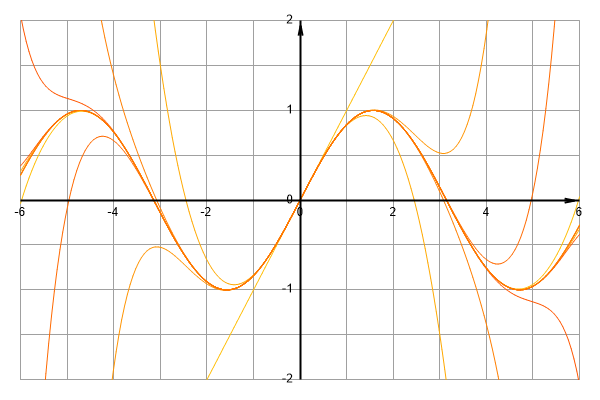
Set how the grid is scaled:
amount is the number of Grid Fields that should be visible in the current view.
The grids size gets scaled by 2**x, where x is a rounded number that's closest to achieving the specified number of visible fields.
Default is 10.
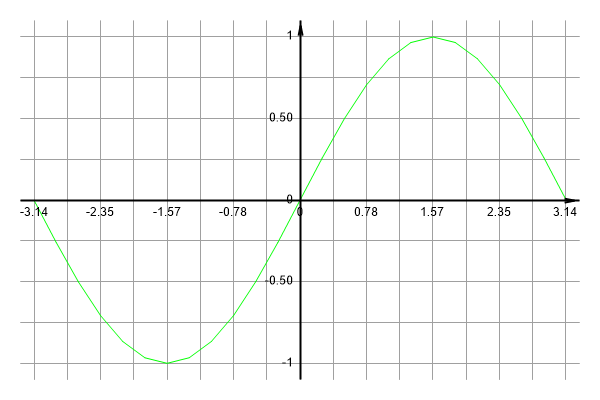
Save a screenshot of the current Graph:
This method is not new. However so far I haven't mentioned it. You can see how it works in my Test Screenshot.ahk.
Here I'd like to thank Helgef for providing the sinus example.